Allow users to slide between layers in a side-by-side comparison map.
Web maps are visual tools to communicate spatial data. Mango’s Visualization tools provide a range of dynamic tools to enhance the communicative power of your maps.
Slide to Compare uses the first two layer groups to display and interactive comparison map. Users can slide side to side to compare similar or disparate layers to instantly see similarities or changes in your data.
This powerful visualisation allows users to easily compare two related maps. Activating a slide-to-compare map places a drag bar in between the top two layer groups, the user can then drag the tab to reveal or hide the underlying layer group.
To enable to the comparison map tool, open the Mango Toolbox, navigate to the “Visualization” tab, click on Comparison Map. From here click the activate button to enable the tool.
Configuring Which Layers Are Comparable
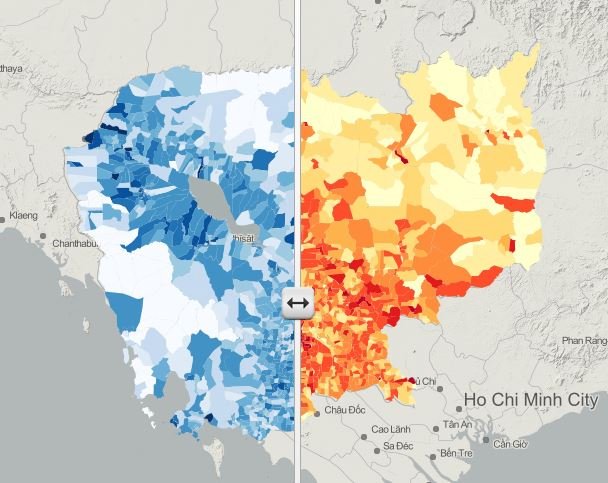
The comparison map tool works by creating a draggable split-screen between the bottom two layer groups in your map.
Left: Bottom layer group
Right: All other layer groups
If you have only one layer group, you will need to create a second layer group in your Layer settings panel. Once the Layer Group is created, drag your second layer from the original group, add a new layer from your datasets, or upload a new layer.
The bottom layer group will show in the left hand side, and the second layer group from bottom will display on the right. Any additional layer groups above these groups will be displayed over the top of the comparison slider.
Remember to make sure that both layer groups have Layer group visible on map load switch on for both layers, otherwise one side of the comparison map will be empty when the map loads.
To learn more, please see the article Layer Groups.