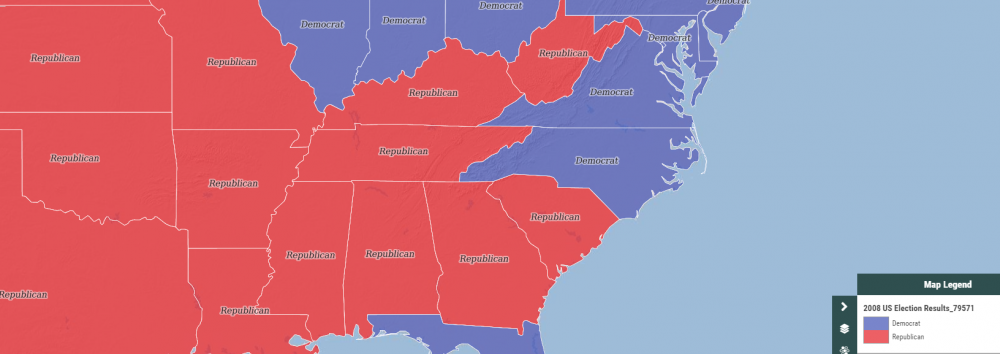
Category layer styling allows you to give features within a layer specific styles based on values in the attribute data.
For example, if you have a dataset that contains election results by U.S State, using a category style you can color each State that was won by the Republicans red and all those won by the Democrats blue, based on the value of “vote_2008” in the data’s attribute table.
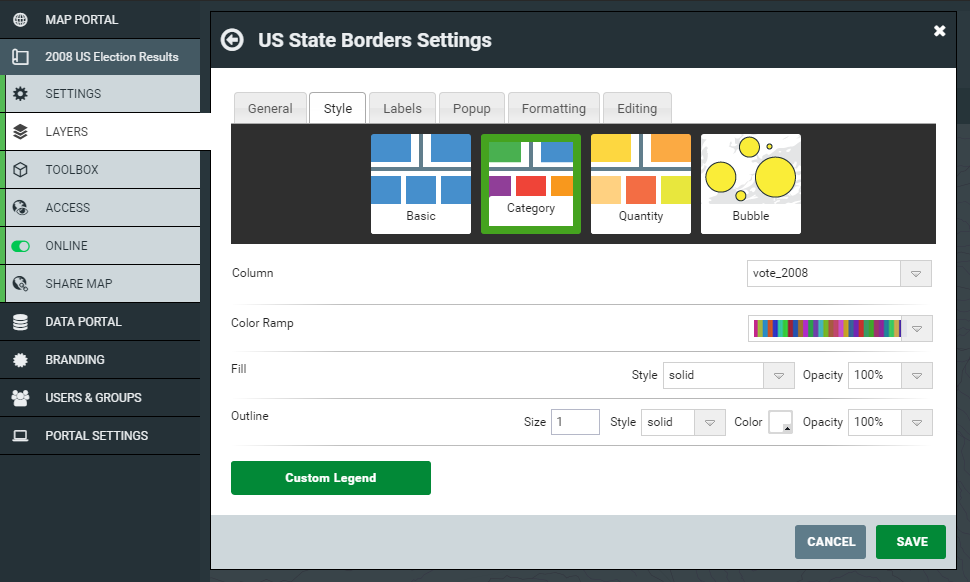
Column
The column dropdown contains the name of each column in the datasets attribute table. You need to select the column that contains the data you wish to make categories for. By default each different value in the column will be given its own color from the selected color ramp.
The category legend is limited to fifty categories, if your datasets column contains more than 50 different values then the first fifty will be used. If you want to only want to have some of the different values in the legend or want to choose your own colors for each category you will need to use the “Advanced Legend Settings” button (see below).
Color Ramp
The color ramp is the range of colors that will be used for each category. Each category will be assigned a color at random from the ramp. If you wish to customise the color of any categories in the legend then you will need to use the “Advanced Legend Settings” button (see below).
Fill / Outline Settings
The fill and outline settings will be applied to all features in the layer.
Custom Legend
The advanced legend settings allow you more fine grained control over your category based legend.
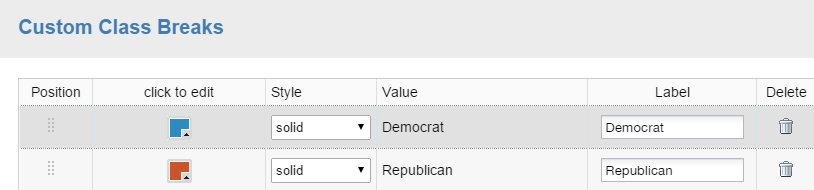
- Position
You can drag and drop categories to change the order in which they will appear in the legend. - Custom colour and fill
You can change the default colour from the color ramp to one of your own choosing. A custom fill pattern can be set for each category. Choose from solids, lines, grids, dots, or arrows. - Label
Changing the label will change the text used to identify the category in the map legend. - Delete Category
Category legends are automatically created from all unique attributes in the selected column. If you do not wish to display all categories, you can remove individual items by clicking the Trash button.
Note that categories do not automatically update when data is updated. If attributes used for the class breaks are removed or added to the dataset, you must reconfigure your custom legend. - Restore Class Breaks to Defaults
If you make any mistakes or want to start again you can press the link to restore the default values.
Note: the number of categories is limited to 50. If the selected column contains more than 50 unique categories, only the first 50 will draw on the map.